|
Today, the Reserve Bank released the data on performance of the private corporate business sector during the fourth quarter of 2025-26, drawn from abridged quarterly financial results of 3,266 listed non-government non-financial companies1. This summary position also includes comparable data for Q3:2025-26 and Q4:2024-25 to enable study of sequential (q-o-q) and annual (y-o-y) change (web-link: https://data.rbi.org.in/DBIE/#/dbie/reports/Statistics/Corporate%20Sector/Listed%20Non-Government%20Non-Financial%20Companies).
Highlights
Sales
-
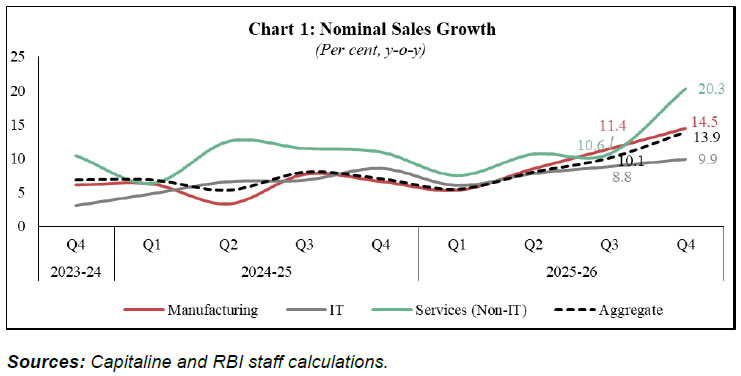
At aggregate level, listed private non-financial companies continued to record a double-digit sales growth of 13.9 per cent (y-o-y) during Q4:2025-26, up from 10.1 per cent in the previous quarter (Table 1A).
-
Sales of 1,817 listed private manufacturing companies expanded by 14.5 per cent (y-o-y) during Q4:2025-26, as compared to 11.4 per cent in the previous quarter. This acceleration was mainly driven by automobiles, electrical machinery and non-ferrous metals industries (Chart 1, Table 2A and 5A).
-
Sales growth of Information Technology (IT) companies continued to improve further to 9.9 per cent (y-o-y) during Q4:2025-26 from 8.8 per cent in the previous quarter.
-
Sales growth of non-IT services companies improved substantially to 20.3 per cent in Q4:2025-26 from the previous quarter, mainly driven by higher sales growth in wholesale and retail trade industry.
Expenditure
-
With global uncertainties, raw material expenses of manufacturing companies rose substantially by 18.3 per cent (y-o-y) during Q4:2025-26; raw material to sales ratio also increased to 58.5 per cent during Q4 from 57.5 per cent in the previous quarter, indicating input cost pressure (Table 2A and 2B).
-
Staff cost growth of manufacturing companies moderated to 9.8 per cent (y-o-y) during Q4:2025-26, compared to the previous quarter. Within services sector, the staff cost growth for non-IT services companies rose at higher pace to 8.9 per cent, while it remained broadly similar for IT companies during Q4 as compared to the previous quarter. Staff cost to sales ratio for manufacturing and non-IT services companies moderated to 5.3 per cent and 9.4 per cent, respectively, in Q4:2025-26; however, it increased marginally for IT companies during Q4 from the previous quarter.
Pricing power
-
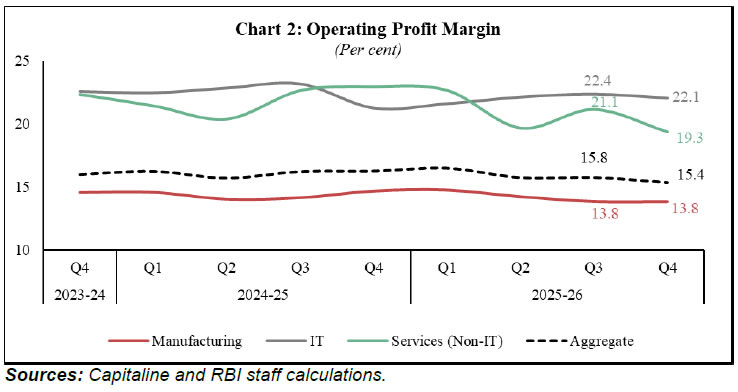
With significant increase in input cost, operating profit growth of manufacturing companies moderated to 9.4 per cent during Q4:2025-26 from 11.8 per cent (y-o-y) in the previous quarter. Operating profit growth of IT and non-IT services companies improved to 14.1 per cent and 6.5 per cent, respectively, during Q4 (Table 2A).
-
On sequential basis, operating profit margin of manufacturing companies remained stable, while it moderated for services sector companies during Q4 (Chart 2 and Table 2B).
Interest expenses
- With higher sequential rise in gross profit than interest expense, manufacturing companies’ interest coverage ratio (ICR)2 improved to 9.5 in Q4:2025-26 from 9.0 in the previous quarter. Within services sector, ICR of non-IT services companies remained unchanged at 2.3 in Q4 from the previous quarter, while ICR of IT firms continued to remain at elevated level during Q4 (Table 2B).
| List of Tables |
| Table No. |
Title |
| 1 |
A |
Performance of Listed Non-Government Non-Financial Companies |
Growth Rates |
| B |
Select Ratios |
| 2 |
A |
Performance of Listed Non-Government Non-Financial Companies – Sector-wise |
Growth Rates |
| B |
Select Ratios |
| 3 |
A |
Performance of Listed Non-Government Non-Financial Companies according to Size of Paid-up-Capital |
Growth Rates |
| B |
Select Ratios |
| 4 |
A |
Performance of Listed Non-Government Non-Financial Companies according to Size of Sales |
Growth Rates |
| B |
Select Ratios |
| 5 |
A |
Performance of Listed Non-Government Non-Financial Companies according to Industry |
Growth Rates |
| B |
Select Ratios |
| Explanatory Notes |
| Glossary |
Notes:
-
The coverage of companies in different quarters varies, depending on the date of declaration of results; this is, however, not expected to significantly alter the aggregate position.
-
Explanatory notes detailing the compilation methodology, and the glossary (including revised definitions and calculations that differ from previous releases) are appended.
(Brij Raj)
Chief General Manager
Press Release: 2026-2027/468
|